![]()
Business Analytics Feature
The Business Analytics feature lets you track statistics about visits to your Web site. You can use it to determine the following kinds of information:
how often your content was viewed
how many site visitors viewed for first time, and how many returned
the most popular referral pages (that is, the Web page from which visitors clicked to arrive on your site)
Several options for selecting a date range let you compare activity across different weeks, months, and years.
This section also contains the following topics.
Enabling the Business Analytics Feature
Templates Tracked by Business Analytics
Tracking Templates vs. Individual Content Items
Specifying the Frequency of Writing to the Database
Summary of Statistical Data Available
Changing the Date Range of the Statistical Data
Analytics Tracker Server Control
Enabling the Business Analytics Feature
By default, the Business Analytics feature is disabled in the web.config file. To enable it, set the value of the ek_enableClassicAnalytics property to true.
<add key="ek_enableClassicAnalytics" value="true" />
If you set this property to true and later change it to false, statistical data remains within Ektron CMS400.NET, but no additional data is collected.
Templates Tracked by Business Analytics
Business Analytics data is tracked for every template that has an Analytics Tracker server control. For details about dropping this server control onto a template, see Analytics Tracker Server Control.
|
Best Practice Drop the control onto an area that does not disrupt the template layout, such as the bottom. |
Note: The Business Analytics feature can only track template views if the viewer’s browser cookies are enabled.
Tracking Templates vs. Individual Content Items
To track visitor activity to a template (for example, customerservice.aspx), drop the server control onto it. To track activity for a content items within that template, use control's properties designed for such tracking. See How the Analytics Server Control Tracks Content IDs.
Specifying the Frequency of Writing to the Database
Once you set up the Business Analytics feature, your database is subject to a continuous barrage of write activity, generated by visits to your site.
To mitigate the effect of this activity on your database’s performance, you can hold visit activity in application server memory until a predetermined amount of data is collected. When that amount is collected, it is moved in one packet to the database. So, the database is “hit” much less frequently.
You can specify the amount of data saved in memory prior to being written to the database using these web.config file elements.
recordsBeforeWrite - the number of unique template visits
timeBeforeWrite - the number of seconds since the last time a database write occurred
When either element reaches the value set in web.config, all records stored in application server memory are written to the database. That event also resets the value of both elements to zero (0).
The Statistical Data
For every template view, the following statistical information is captured.
url - the visited page
content_id - the ID of the visited content. Captured by the Analytics server control. See Also: How the Analytics Server Control Tracks Content IDs Tracking Templates vs. Individual Content Items
visitor_id - a unique GUID that identifies a visitor
hit_date - date and time when a page view occurred
referring_url - the URL a user was viewing before jumping to the visited page
visit_type - zero (0) indicates new visitor, 1 indicates returning visitor, 2 indicates all other views. See Also: Tracking Site Visitors
After a user logs on, the first page hit tracks the visit as zero (0) (if the user is new) or 1 (if the user previously visited the page). From then on, 2 is logged for that user.
Tracking Site Visitors
The Business Analytics feature provides information about visits made by new versus returning visitors. To capture this data, the feature asks this question whenever a page is visited: is the user logged in as either a membership or regular user?
If yes, capture the user ID with the statistical data
If no, place a cookie on the visitor’s computer
So, the first time a user visits a page, either user information is captured or a cookie is created.
The next time the user visits that page, the feature checks the visit history for the user ID, or for a cookie. If either is found, the visit is considered a return.
New Visitor Statistical Tracking
The same user visit may be considered new on one view but not on another. For example, someone visits on January 30 (Monday) then again February 2 (Thursday). On the monthly statistics, that visitor is new, but on the weekly statistics, the February 2 hit would be a return visit (his second this week).
Now consider a second visitor, who browses to your site on the first and 20th of the month. These visits would appear on weekly statistics as two new visits, but on the monthly statistics, only the first visit would show up on that month's tally of new visitors. The second visit would add to the return visitor statistics.
Writing to the IIS Log
In addition to writing Business Analytics data to the database, you can write it to the IIS log. To do this, enable the appendToIISLog element in the web.config file.
Note that if you set appendToIISLog to true, some Business Analytics data is only written to the IIS log and does not appear in the Workarea.
Business Analytics Reporting
The Business Analytics feature's reports let you drill down from the entire site to individual templates to individual content items.
Prerequisite: In your site's web.config file, the ek_enableClassicAnalytics setting must be set to true.
Note: The Most Popular and Trends Widgets also report on Business Analytics data. See The Most Popular Widget and The Trends Widget .
To access Business Analytics Reports, follow these steps.
Either
1. Browse to a content item for which Business Analytics data is being captured.
2. Right click the mouse.
3. Choose View Template Activity to see Business Analytics data for the current content item (to learn more about data captured for one content item, see Content).
4. ChooseView Site Analytics to view Business Analytics data for the entire site.
or
1. From the Ektron CMS400.NET Workarea,choose Reports > Business Analytics to view analytic data for the entire Web site.
Five levels of reporting are available.
Summary of Statistical Data Available
The following table lists the kinds of analytic statistics that can be viewed at each level of the site.
|
Type of Statistical Information |
Site-wide |
Template- |
Content- |
|
Views of Any Template |
|

|
|
|
Visitors: New and Return |
|
|
|
|
Pie Chart of New vs. Return Visitor |
|
|
|
|
Pie Chart of Views/Visitors Ratio |
|
|
|
|
Bar Graph of Views/Visitors Ratio |
|
|
|
|
|
|
||
|
Visited Content Blocks |
|
|
|
|
|
|
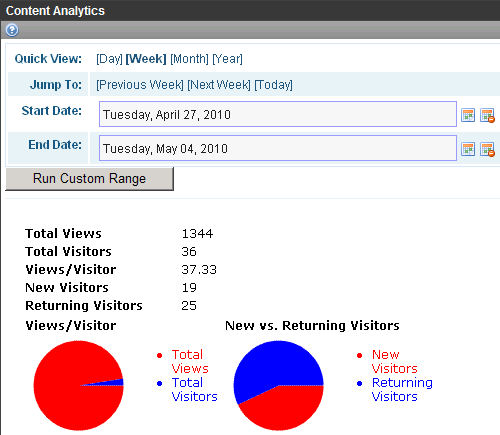
Site Statistics
The Site Statistics screen offers an overview of all tracked activity within the selected date range. You see actual data for the
number of views
number of visitors
ratio of visitors per view
number of new and returning visitors
ratio of new to return visitors
Below this data are pie charts of the ratio of views to visitors and new vs. return visitors.
Note: To understand how new and returning visitors are tracked, see Tracking Site Visitors.
See Also: Analytics Tracker Server Control
Content
The Content View shows the most frequently-accessed content items on your Web site.
See Also: Tracking Templates vs. Individual Content Items, Business Analytics Feature
You can click any content item to view
Content Statistics - statistics for that content item only (See Also: Site Statistics)
Content Activity - relative activity for that content item only (See Also: Content)
Audit Content - all users who viewed the selected content item; to the right of each user are the date and time when the content was viewed
Note: Only users who viewed the content after logging in appear on the list. Visitors to your site who do not log in affect statistics but are not tracked on this report.
Templates
The Templates View shows all viewed templates on your Web site, with the most frequently-accessed ones on top.
By default, the templates at the top have the highest number of unique visitors. You can change the sort by clicking on any column header. For example, to sort templates by the number of views, click Views.
See Also: Business Analytics Feature
You can click any template to view
Template Statistics - statistics for that template only (See Also: Site Statistics)
Template Activity - relative activity for that template only
Content in Template - if a content items was specified for the template in the Content Analytic server control, this view show statistics for the template. You can click the template to view Template Level activity. (See Also: Business Analytics Feature)
Referrers
The Referrers View shows the domains from which your site was most frequently accessed.
See Also: Business Analytics Feature
Changing the Date Range of the Statistical Data
When you first view statistical data, the default date range is today (one day).
If you view statistics for different date ranges, when you return to the screen, the last selected date range is the default selection. You can change it if needed.
Using Quick View Options
Use Quick View options to view analytic statistics for any of the following time periods.
one day
one week
one month
one year
When you click Quick View [week], [month] or [year], the current end date is used as the last day of the range. Here are some examples.
|
Quick view time option |
If end date is today, begin date is |
|
Week |
one week earlier than today |
|
Month |
one month earlier than today |
|
Year |
one year earlier than today |
Using Jump To Options
Use Jump To options to view analytic statistics for a time period before and after the current date range. The time period is determined by the Quick View increment. For example, if the Quick View option is Day, you can jump to the previous day, the following day, or today.
Regardless of the Quick View increment, you can always view statistics for today.
|
Quick view option |
If end date is today, begin date is |
|
Day |
previous day next day today |
|
Week |
previous week next week today |
|
Month |
previous month next month today |
|
Year |
previous year next year today |
 P. 1 of 3

![]()